My microblogging set-up right now is that I post to my WordPress blog, and allow Micro.Blog to syndicate to its platform. Then MB crossposts to Twitter, and the Mastodon Twitter Crossposter (https://micro.blog/account/feeds ) posts to Mastodon.
Posted on August 19, 2018
Read More
Hello world!
Posted on August 19, 2018
Read More
Mowing wouldn’t be so bad if it wasn’t so humid. ?
Posted on August 19, 2018
Read More
@manton Feature request: Can you add a way in the iOS app to add text descriptions to images as an accessibility aid? Seems like the text description could be added to the img tag as alt text. (Or does this already exist and I’m just missing it?) Thanks!
Posted on August 16, 2018
Read More
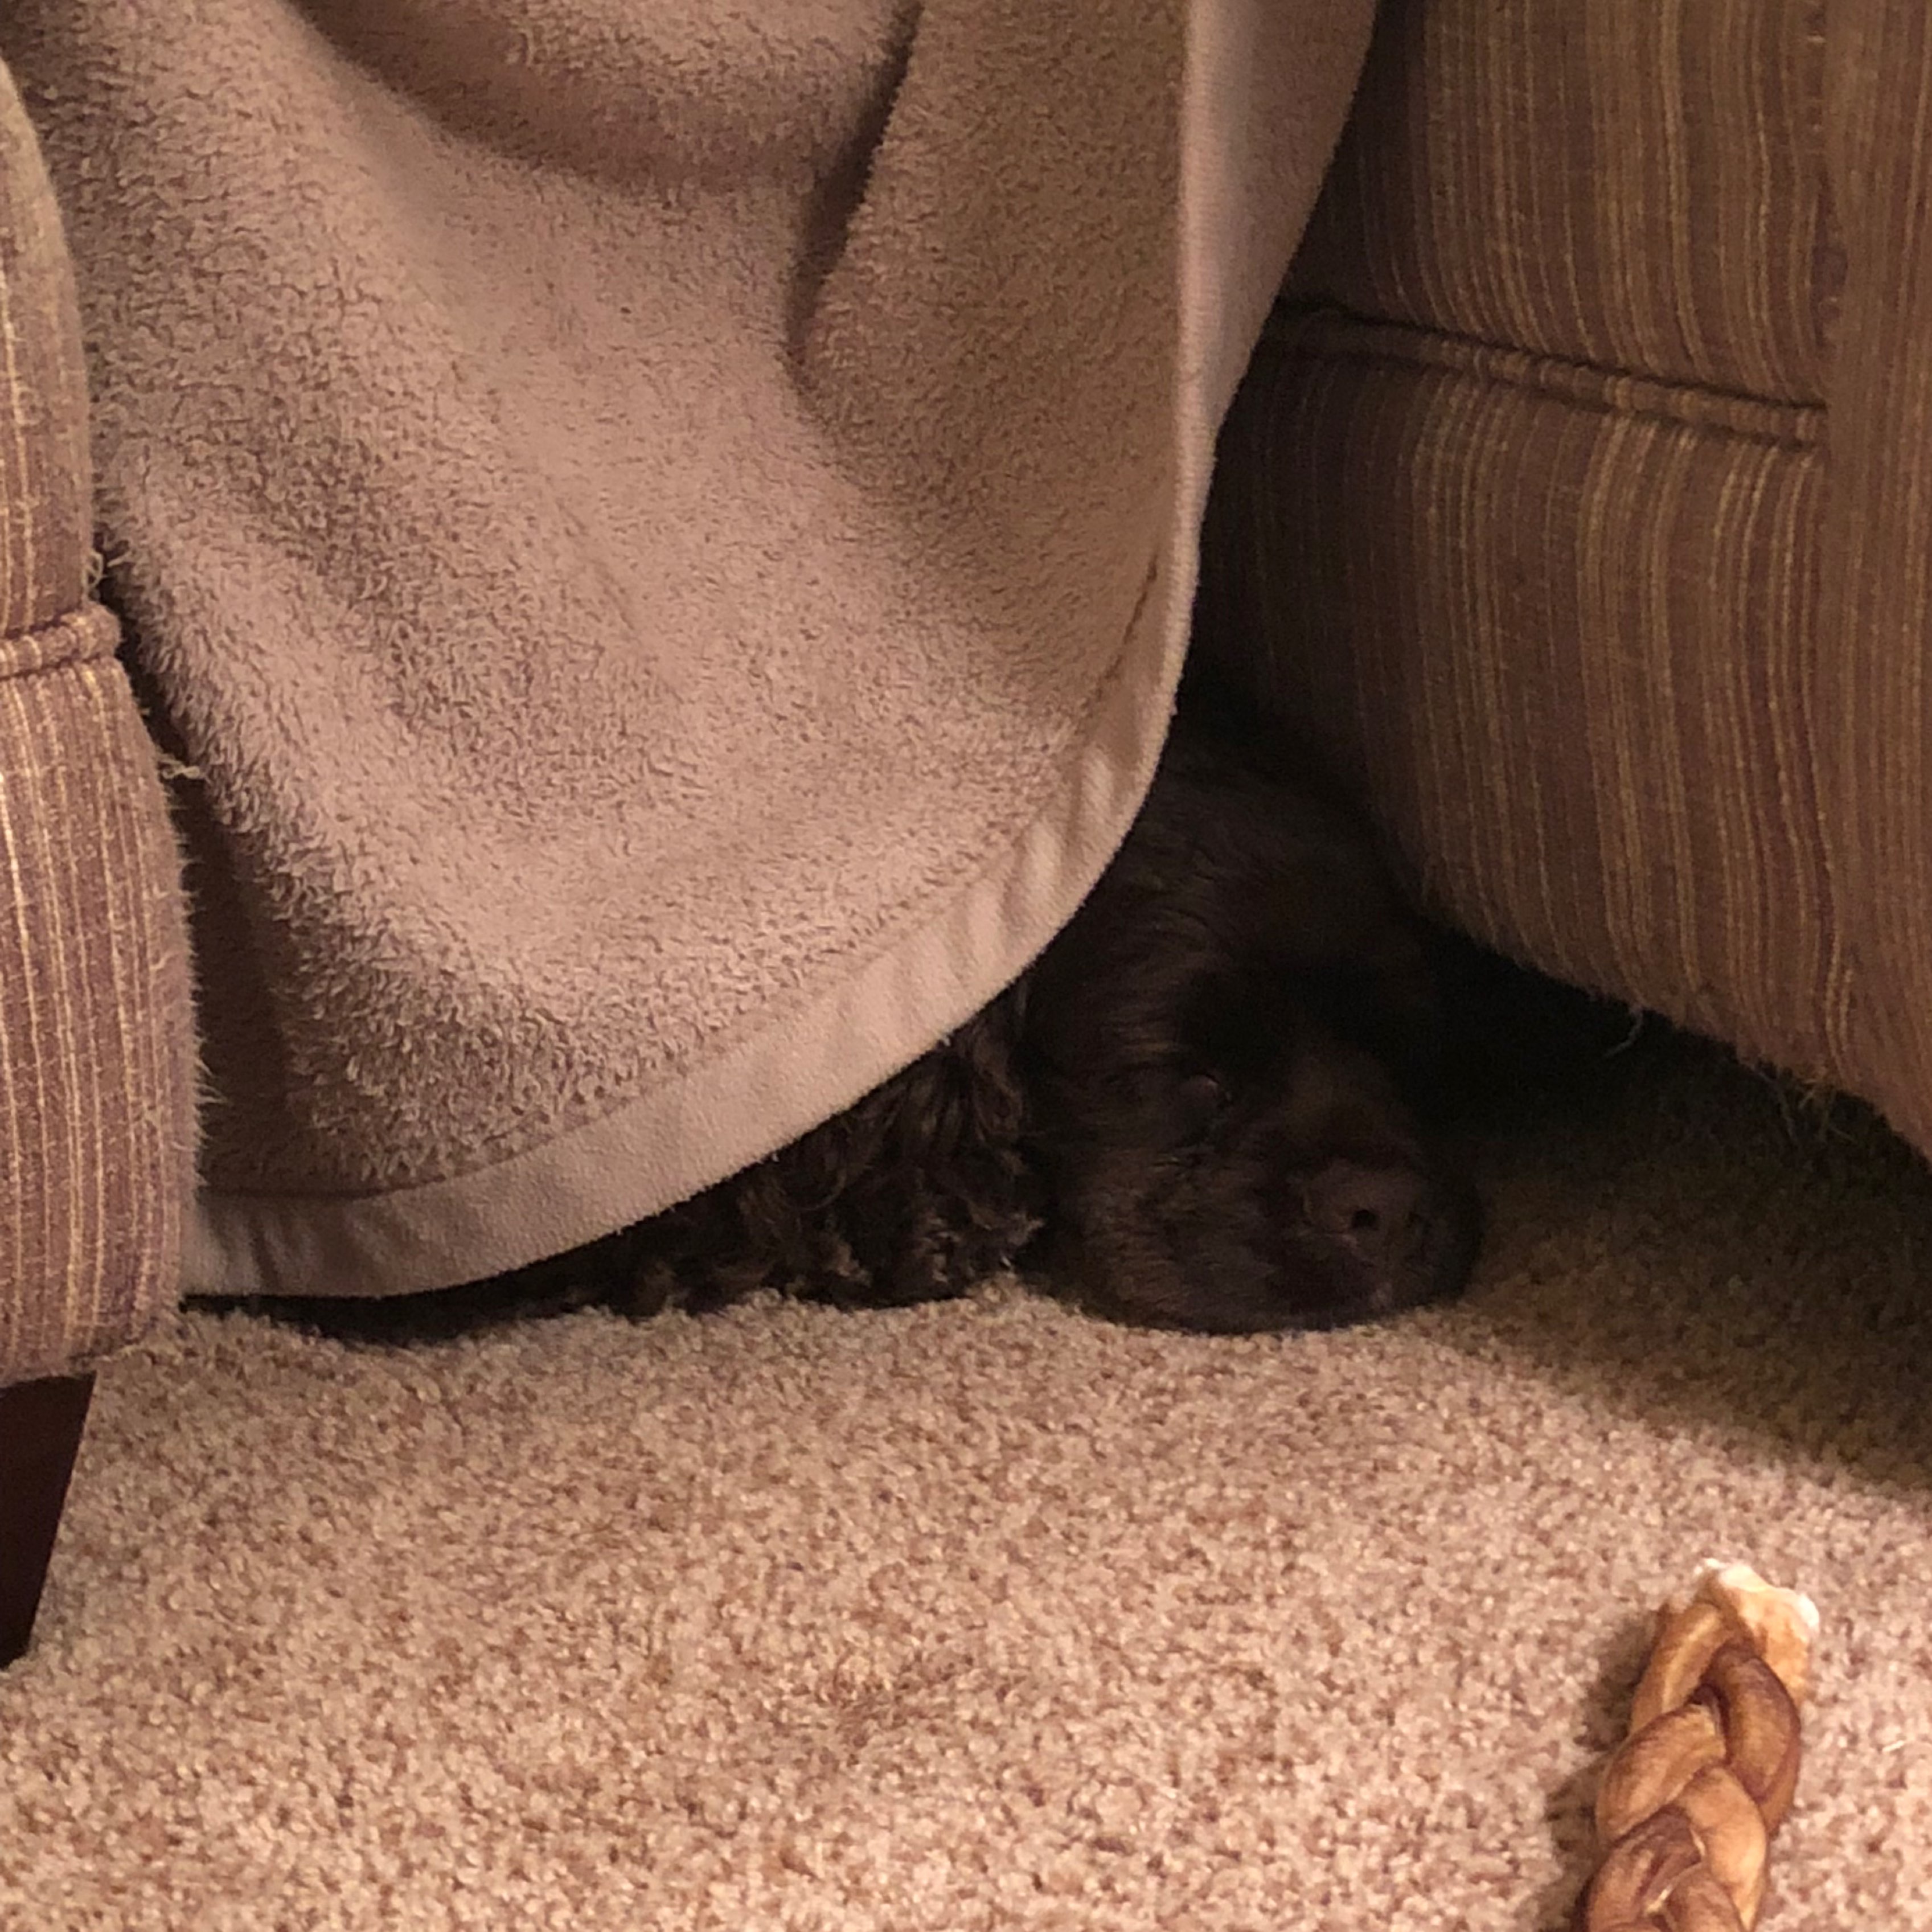
Brigit taking a nap in her makeshift dog house.
Posted on August 16, 2018
Read More
I’m presenting at an Indiana CPA Society conference tomorrow, and I just found a typo that had been copy-and-pasted throughout my slide deck. And now I’m afraid that there are others that I’m missing. ?
Posted on August 16, 2018
Read More
More puppies! Here’s a photo of my pup Brigit the day we brought her home. ?
Posted on August 16, 2018
Read More
More puppies! ?
Posted on August 15, 2018
Read More
Full Archive
Select Month
July 2026 (22)
April 2026 (37)
November 2025 (1)
October 2025 (30)
September 2025 (12)
August 2025 (1)
May 2025 (6)
April 2025 (1)
March 2025 (3)
February 2025 (2)
January 2025 (2)
October 2024 (4)
September 2024 (1)
July 2024 (23)
June 2024 (3)
May 2024 (6)
April 2024 (35)
March 2024 (3)
February 2024 (1)
January 2024 (1)
December 2023 (8)
November 2023 (5)
October 2023 (2)
September 2023 (38)
August 2023 (6)
July 2023 (3)
June 2023 (10)
April 2023 (39)
March 2023 (4)
February 2023 (2)
January 2023 (4)
November 2022 (24)
October 2022 (8)
September 2022 (36)
July 2022 (7)
June 2022 (11)
May 2022 (13)
April 2022 (13)
January 2022 (1)
December 2021 (3)
November 2021 (3)
October 2021 (47)
September 2021 (2)
August 2021 (5)
June 2021 (2)
April 2021 (4)
March 2021 (7)
February 2021 (2)
January 2021 (6)
December 2020 (8)
November 2020 (14)
October 2020 (12)
September 2020 (1)
August 2020 (7)
July 2020 (7)
June 2020 (13)
May 2020 (11)
April 2020 (32)
March 2020 (14)
February 2020 (21)
January 2020 (5)
December 2019 (8)
November 2019 (30)
October 2019 (17)
September 2019 (31)
August 2019 (24)
July 2019 (14)
June 2019 (10)
May 2019 (35)
April 2019 (20)
March 2019 (13)
February 2019 (8)
January 2019 (1)
December 2018 (6)
November 2018 (19)
October 2018 (56)
September 2018 (21)
August 2018 (28)
July 2018 (12)
June 2018 (31)
May 2018 (19)
April 2018 (32)
June 2017 (1)
May 2017 (1)
March 2017 (2)
January 2017 (1)
May 2016 (1)
April 2016 (1)
March 2016 (2)
February 2016 (14)
January 2016 (1)
November 2015 (1)
October 2015 (1)
July 2015 (2)
June 2015 (2)
March 2015 (1)
January 2015 (2)
December 2014 (1)
June 2014 (5)
November 2013 (2)
October 2013 (1)
August 2013 (1)
June 2013 (2)
November 2012 (1)
October 2012 (1)
September 2012 (2)
September 2010 (1)
July 2010 (1)
February 2010 (1)
January 2010 (1)