Month
January 2015
Since publishing my piece on revenue distribution in the App Store yesterday, I’ve gotten some feedback from readers asking how valid my extrapolated data is. Some have pointed out that I’m working with a limited data set from only one app that might not hold for all apps. Others have pointed out that the daily revenue data that Marco Arment provided did not include any data from the period when Overcast was at the top of the U.S. Top Grossing list, so it’s possible that the curve isn’t really a strict power curve all the way up the charts.
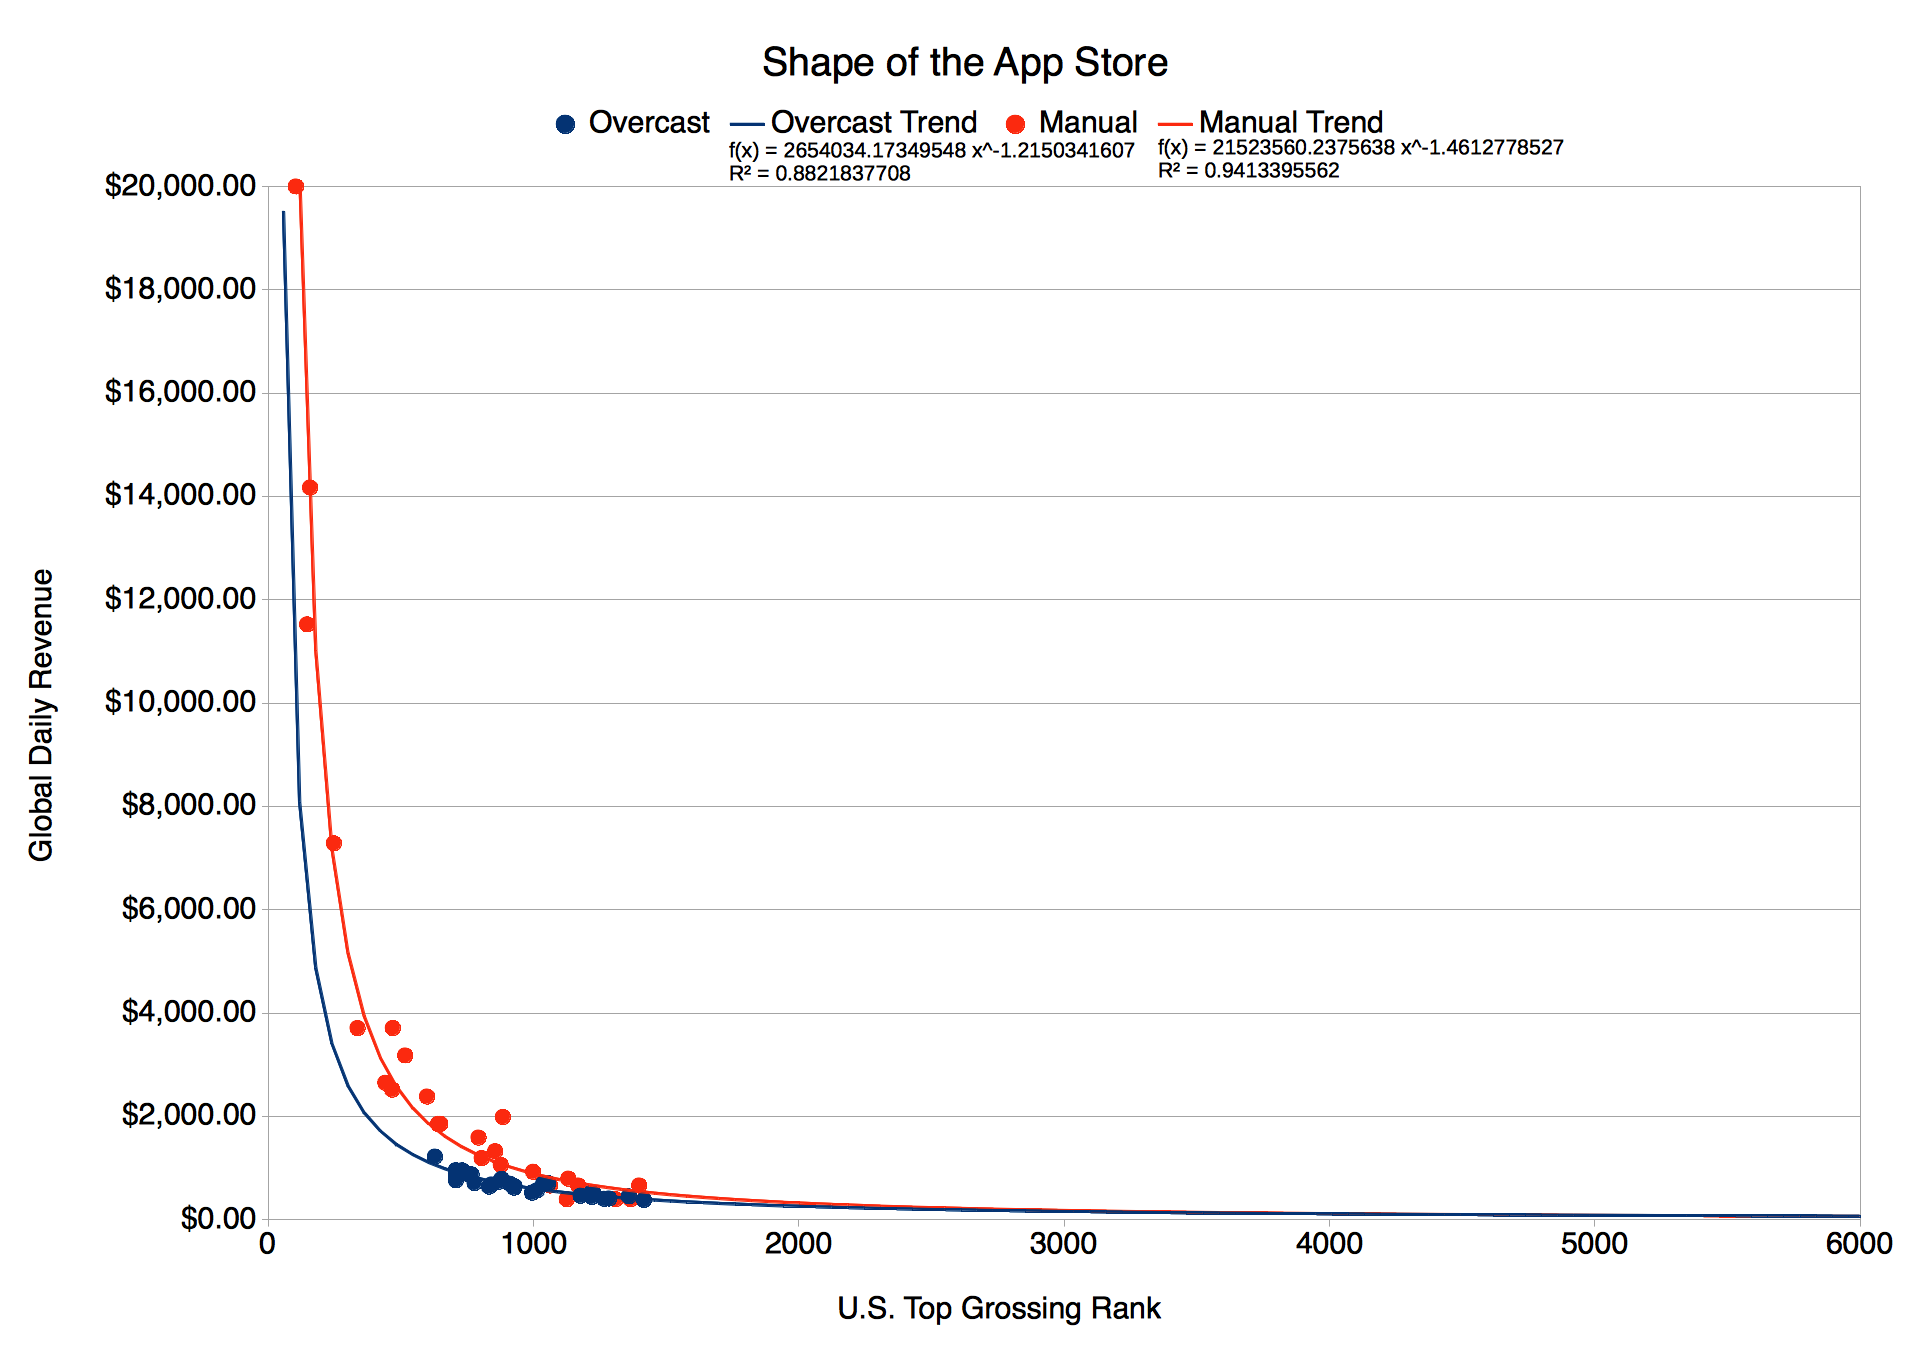
These are valid criticisms. So let me respond by releasing more data; the only other useful data that I have available. In response to Marco’s post, William Wilkinson published financial data from his own app, Manual. Manual is a photography app that did well on the U.S. Top Grossing list (reaching as high as number 104) in September 2014, so the Manual revenue data is both contemporaneous with Overcasts’s and useful for examining the upper reaches of the App Store. The problem with the data Wilkinson released is that the daily revenue graph has a very low resolution. In reading the graph, I could estimate daily revenue to only ±$133. That’s not such a big deal at the high end, where daily revenue is measured in the tens of thousands of dollars, but in the long tail where revenue is measured in the hundreds of dollars, a $133 error is quite significant. With this limitation in mind, below is the graph of Manual’s data overlaid onto Overcast’s.
As you can see from the graph, the revenue curve for Manual breaks upwards a little before Overcast’s does, but overall they are very similar curves. In particular, notice that the “head” end of these graphs (U.S. Top Grossing #1 to about #1000) follow similar paths. It seems likely to me that the differences between the graphs can be accounted for by the daily fluctuations of the App Store, differing ratios of U.S. to global sales, and the inherent inaccuracy that comes with estimation.
So what does this mean? Well, it makes me think that I was on the right track with my original post. While the the exact revenue figures that I cited in The Shape of the App Store may be off little, it seems likely that they are at least in the right ballpark. They may even be somewhat conservative estimates if Manual’s revenue figures are to be believed. Whatever the exact figures, one thing is clear: Revenue is heavily skewed towards the top of the charts, to a much higher degree than I, at least, expected.
Posted on January 20, 2015
Every developer knows how tough it can be to make a living on the App Store. There’s a lot of money being made there, but it’s not spread very evenly. Those at the top of the charts make the lion’s share of revenue, while the vast majority are left to fight over the scraps. But exactly how lopsided is it? And how does that affect an indie developer’s chances of finding success? For a long time, I was resigned to never really knowing the answers to these questions, because although there’s wide consensus that the distribution of revenue in the App Store is best represented by a power law, I had no way of knowing how sharply or gently the graph of that power law curved. My own apps haven’t spent enough time on the Top Grossing list to collect the data I would need to make a prediction, and Apple sure isn’t sharing it.
And then on January 15, Marco Arment gave me (well, all of us) a belated Christmas present. In his piece titled Overcast’s 2014 Sales Numbers, Marco shared the financial performance of his podcast player, Overcast, through a series of statistics and graphs. Because the information he shared was so detailed, and because Overcast has been so successful, I realized that Marco’s post could provide some insight into how an app’s rank on the U.S. Top Grossing list correlates with its daily revenue.
Before we get to the results, it’s important to first discuss their limitations. The figures that Marco provided for Overcast were very detailed, including daily revenue information, but they weren’t complete. Of particular importance, the revenue figures that Marco published were for global revenue. There was no breakdown of the revenue provided by nation. This means that it’s possible only to compare rank in the U.S. App Store to global revenue. It’s not a perfect apples to apples comparison, but since the U.S. App Store is the largest national App Store both by downloads and by revenue, I think it’s a reasonable comparison to make.
To provide some context to the results, you may be familiar with the Pareto distribution. It’s the origin of the classic “80-20 rule” that’s used to explain so many phenomena that obey a power law. “Twenty percent of the people in an organization do eighty percent of the work.” “Twenty percent of the population control eighty percent of the wealth.” You hear these types of statistics a lot, but they’re usually not very accurate. Often, they are useful as a first estimate at best. So I didn’t actually expect App Store revenue to obey the 80-20 rule. In fact, I expected it to be a much sharper curve, representing even greater disparity in the distribution of revenue than the 80-20 rule would suggest – maybe a 90-10 split, or even a 95-5 split. As it turns out, the revenue distribution curve of the App Store is even sharper than I imagined.
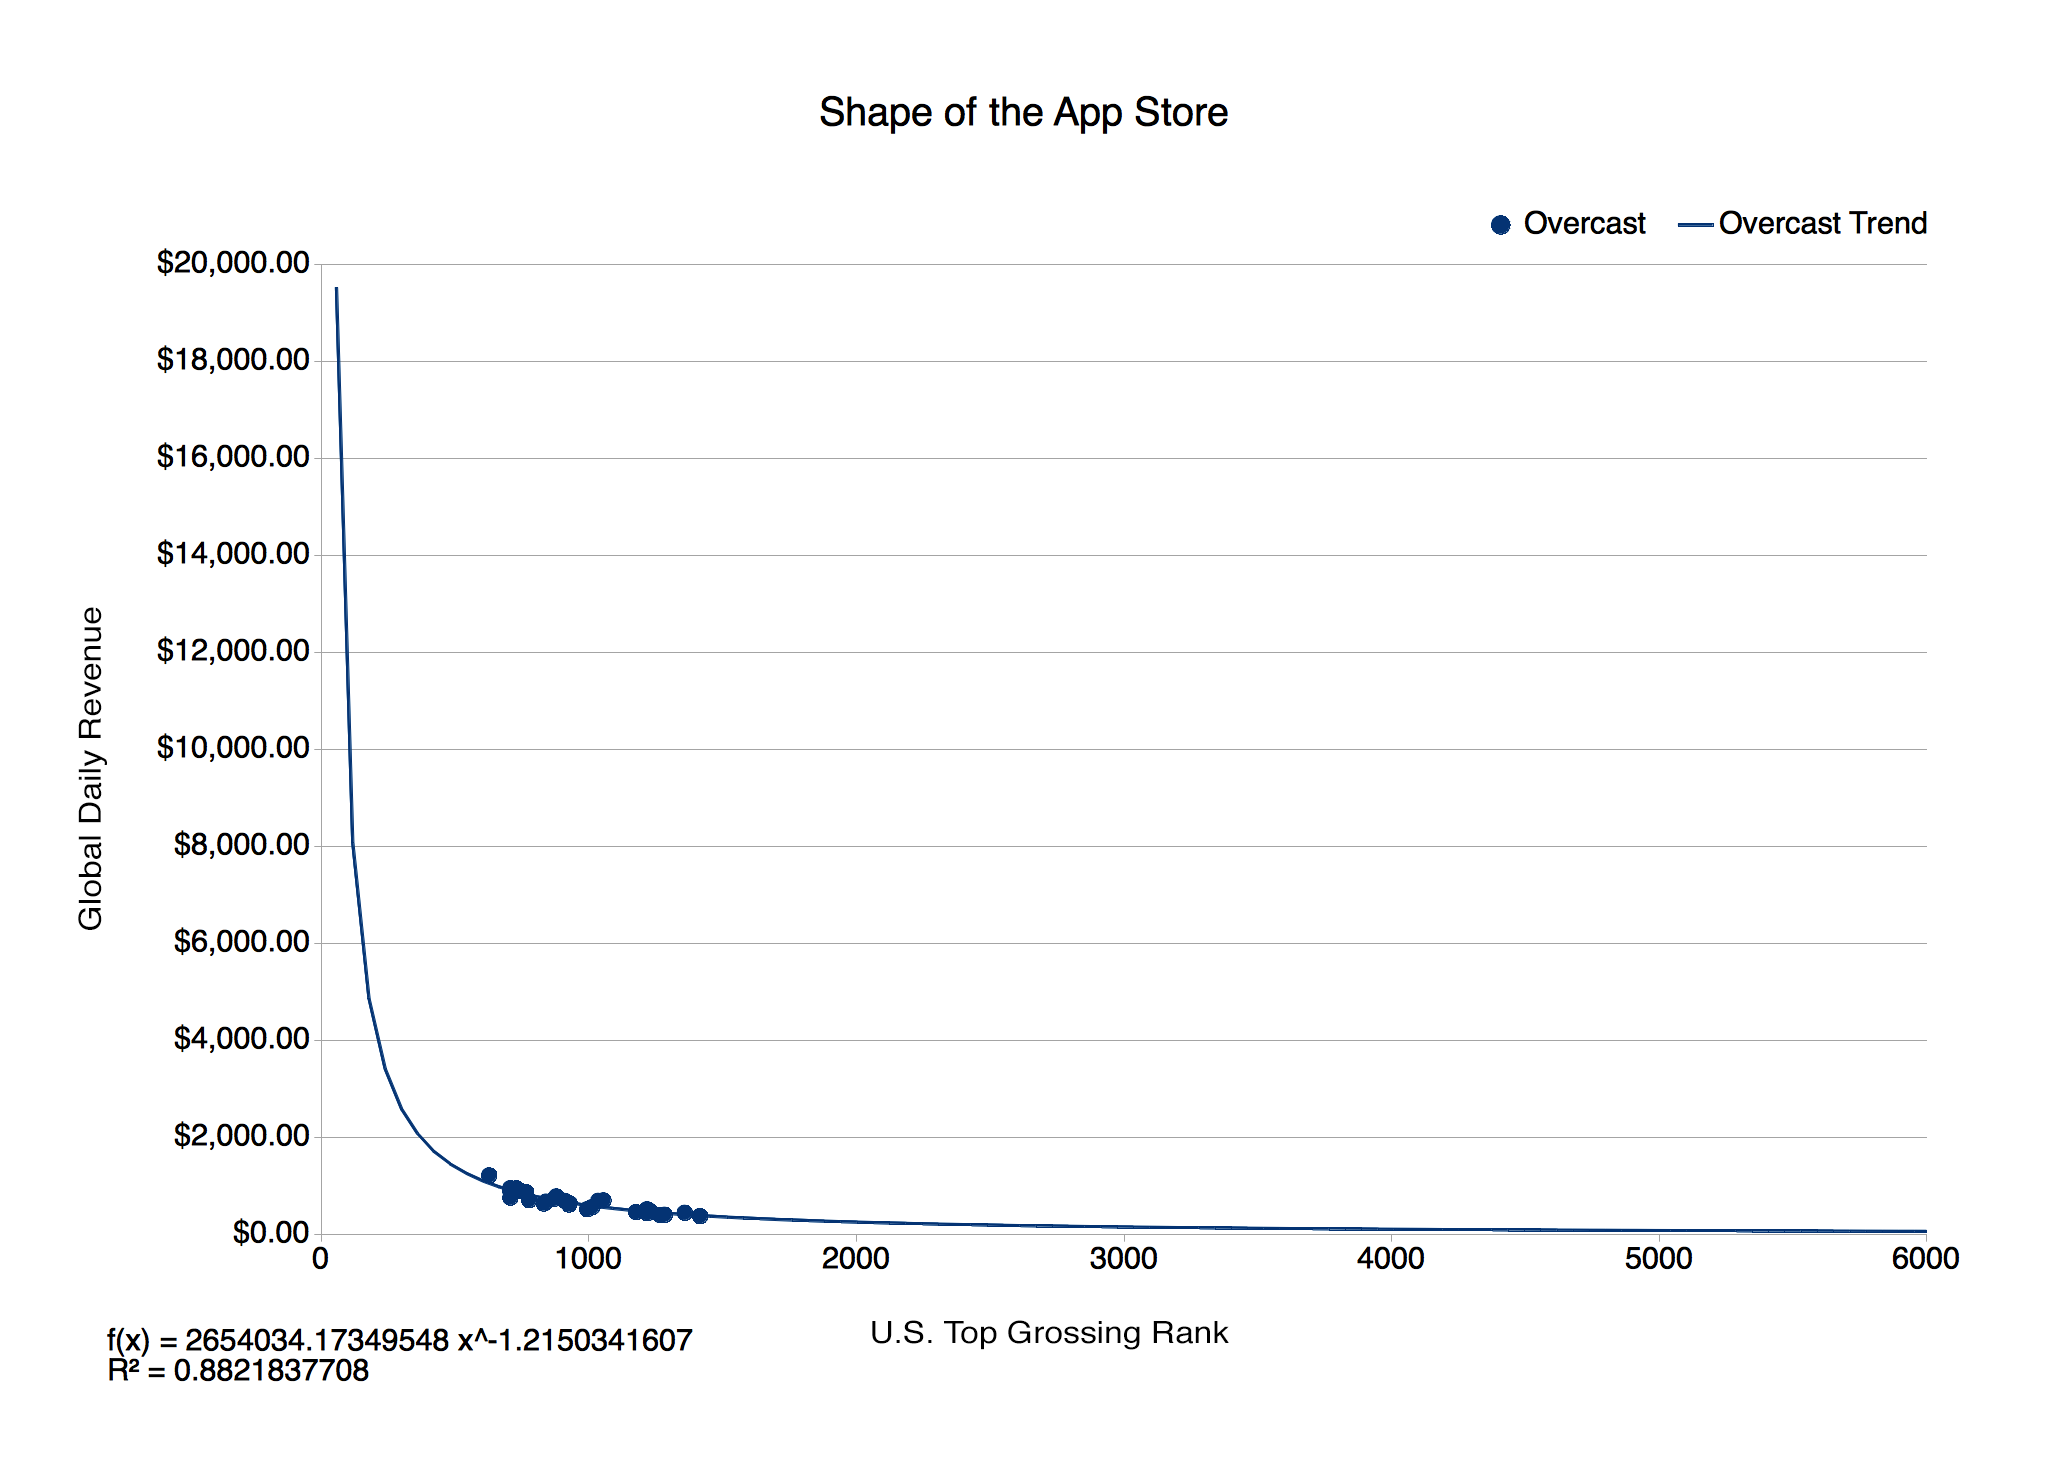
I expected a “hockey stick” curve that’s characteristic of power law models, but I didn’t expect one like this. The hockey stick breaks upwards at around position 870 on the U.S. Top Grossing list. With about 1.2 million apps in the App Store at the time the data was collected, that arguably puts 99.93% of apps in the “long tail” of the App Store. The “head” of the App Store, those 870 top grossing apps that make up 0.07% of the App Store population, collect over 40% of the App Store revenue that’s paid out.
Luckily, there’s a lot of money to be made in that long tail. At the top of the long tail, in position 871 on the U.S. Top Grossing list, an app still makes over $700 in revenue per day. That’s almost $260,000 per year. Even number 1,908 on the U.S. Top Grossing list makes over $100,000 per year. In fact all apps above number 3,175 on the U.S. Top Grossing list produce enough revenue to at least make its developer the United States household median income for 2014 ($53,891). And this is just for a single app. Most indies I know develop more than one app simultaneously. Developers who can put together a collection of apps that rank at about 6000 on the U.S. Top Grossing list (about $25,000 in revenue per year) stand a good chance of building an app business that can sustain them and their families.
Now, all of that is not to suggest that it’s easy to build a sustainable app business. It’s not. But, by doing some basic business things right – like finding a profitable niche, solving a painful problem, effectively marketing apps, and generally doing the things that have been suggested time and again at conferences and on podcasts – a developer can dramatically increase his odds of out performing the multitudes that just slap any old thing up on the App Store and hope for the best.
So, with even fewer people than I expected making “yacht and helicopter money” in the App Store, I remain hopeful for my fellow developers. There’s a lot money circulating in the ecosystem, and a developer operating at indie scale only needs a little bit of it. It seems that even with the revenue curve tilted so heavily towards the big hits, the shape of the App Store still allows room for sustainable businesses to develop in the long tail. It seems that developers who work hard, mind the details, and treat their business like a business have a real chance of making it.
Note: I’ve posted a follow-up to this article titled, The Shape of the App Store, Redux that responds to some valid criticism that’s been received regarding the data set used here.
Update Jan (20° 20°)15: This post was updated to clarify that an app’s rank in the U.S. Top Grossing list is being compared to its global revenue.


